
We often measure screen time in terms of productivity—but what if it’s also a mirror for our mental well-being? Last quarter, I started tracking my device usage to find out.
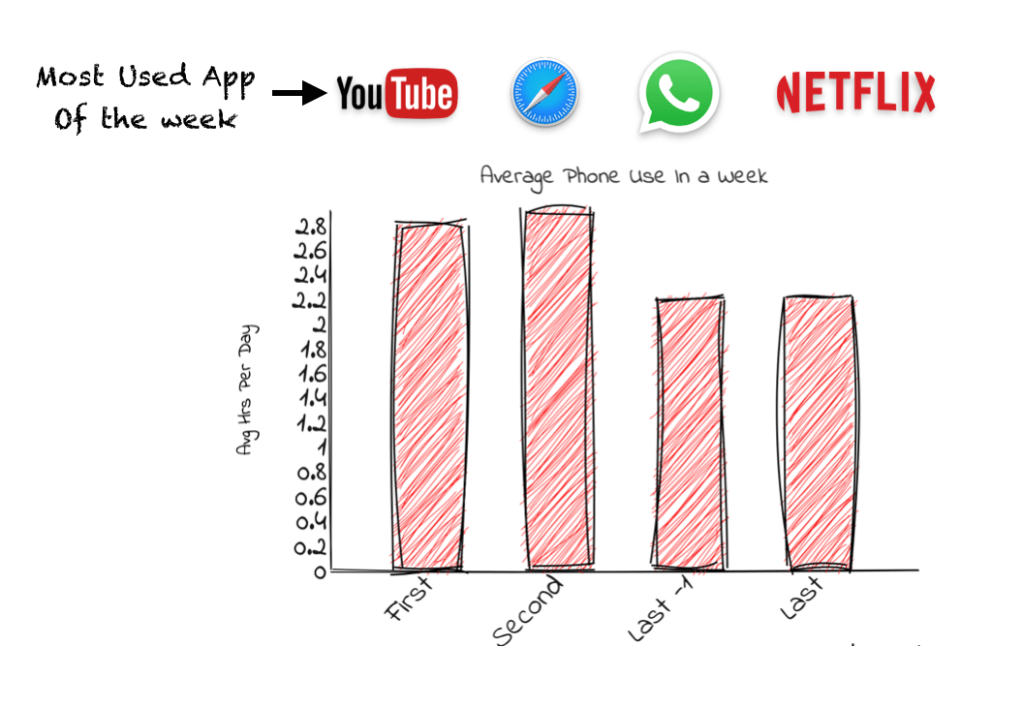
iPhone: Small Wins
My daily phone use dropped from 2.8 hours/day in Week 1 to 2.2 hours by the last week. (See chart below.) Even a 30-minute reduction felt significant—less mindless scrolling meant more time for reading and offline hobbies.
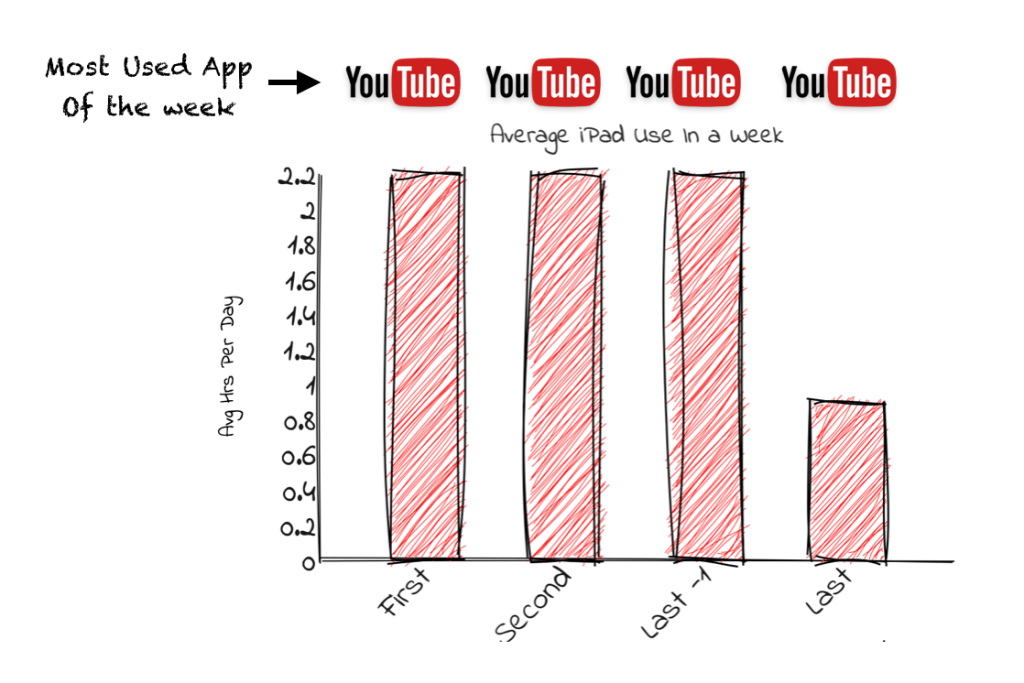
iPad: The YouTube Trap
My iPad told a different story: a steady 2.2 hours/day, mostly on YouTube. The exception? A sudden drop to 0.9 hours in the final week (more on that later).
These stats don’t reveal any deep insights. I will have to dig deeper into this.
Next Steps:
I’ll analyze two key windows next:
- 12am–6am (Does late-night scrolling disrupt my sleep?)
- 12pm–6pm (Is afternoon procrastination tied to low energy?).
Stay Tuned!
Reference Data
| Week | Device | Total Screen Time | Pickups | Most Used App | Most Used Time | Most Pickups | Most picked up |
|---|---|---|---|---|---|---|---|
| Last Week | iphone | 15.3 | 689 | Netflix | 2.3 | 125 | |
| ipad | 6.3 | 52 | Youtube | 3.3 | 34 | Youtube | |
| Second Last Week | iphone | 15.3 | 754 | 3 | 133 | ||
| ipad | 15.6 | 99 | Youtube | 13 | 69 | Youtube | |
| Second Week | iphone | 20 | 674 | Safari | 2.6 | 101 | |
| ipad | 15.5 | 73 | Youtube | 11 | 33 | Youtube | |
| First Week | iphone | 19.6 | 639 | Youtube | 3.3 | 100 | |
| ipad | 15.2 | 88 | Youtube | 12.5 | 68 | Youtube |

Leave a comment